🌾 Rice Disease AI – Youth Digital Citizen Challenge Submission
1. Challenge Context & Problem Statement
This project is developed for the Youth Digital Citizen Challenge: AI for Climate Changes – Twin Transition in Action.
Climate change is increasing the frequency and severity of rice diseases through altered rainfall patterns, rising temperatures, and extreme weather events. Rice farmers often detect diseases too late, leading to rapid outbreaks, yield loss, and excessive pesticide usage. There is a lack of early-warning systems that combine on-field visual evidence with spatio-temporal outbreak forecasting.
This project proposes an AI-powered decision support system that:
- Detects rice leaf diseases from images taken by farmers
- Filters out non-rice images to avoid noise
- Forecasts the risk of disease outbreak within the next 7 days at a regional (grid) level
The system is designed for real-world deployment in hackathon conditions: lightweight models, modular APIs, and extensible pipelines.
2. Solution Overview
The solution consists of three core AI components, each implemented as an independent script/module:
- Rice / Non-Rice Image Filtering
→ Ensures only valid rice images are processed downstream - Rice Leaf Disease Classification
→ Identifies the disease type from rice leaf images - 7-Day Disease Outbreak Forecasting
→ Predicts whether a disease outbreak will occur in the next 7 days based on crowd-sourced reports and weather signals
These components can be deployed independently or integrated into a single backend service.
Pipeline Diagram
Input Image
   ↓
MobileNetV3-Small
(Rice / Non-Rice)
   ↓
DINOv2 + MLP
(Disease Class)
   ↓
XGBoost
(Outbreak Risk T+7d)
Model Table
| Stage | Model             | Input               | Output             | Why                        |
| ----- | ----------------- | ------------------- | ------------------ | -------------------------- |
| 1     | MobileNetV3-Small | Image               | Rice / Non-rice    | Remove noisy farmer images |
| 2     | DINOv2 + MLP      | Rice image          | Disease class      | Strong generalization      |
| 3     | XGBoost           | Tabular time-series | Outbreak risk (7d) | Non-linear interactions    |
3. System Architecture
Farmer Mobile App
      │
      ▼
[ Rice / Non-Rice Filter ]  (MobileNetV3)
      │
      ▼
[ Disease Classifier ]      (DINOv2 + MLP Head)
      │
      ▼
[ Outbreak Forecasting ]    (XGBoost – 7 days ahead)
      │
      ▼
Risk Map • Alerts • Recommendations
4. Model 1 – Rice / Non-Rice Image Filtering
Objective
Design a lightweight filtering model to remove non-relevant images (soil, grass, cattle, background scenes) before downstream rice disease classification, ensuring clean and reliable inputs.
Dataset Construction
Rice images: Rice Leaf Disease datasets
Non-rice images: Soil, grass, and cattle datasets collected from Kaggle
Data integrity:
-
Duplicate images across sources were removed using MD5 hashing
-
This prevents train–validation leakage and artificially inflated performance
Class balance strategy:
- Non-rice samples were capped to limit class dominance
Model Design
Backbone: MobileNetV3-Small (ImageNet pretrained)
Task: Binary classification (Rice vs Non-Rice)
Design rationale:
-
Chosen for its low computational cost and suitability for edge / cloud-GPU deployment
-
Optimized for early-stage filtering rather than fine-grained recognition
Training Strategy
Loss: BCEWithLogitsLoss with class weighting to mitigate imbalance
Optimizer: Adam
Validation threshold: 0.8, intentionally increased to reduce false positives
Regularization: Early stopping based on validation loss
Augmentation: Spatial and color perturbations to improve robustness
Output Artifact
best_model.pt
Evaluation Results
| Metric                 | Value                                       |
| ---------------------- | ------------------------------------------- |
| Task                   | Binary detection (Rice plant vs background) |
| Model                  | MobileNetV3-Small                           |
| Training epochs        | 5 (early stopping)                          |
| Training accuracy      | 98.4% → 100%                                |
| Validation accuracy    | 88.9% – 91.1%                               |
| Precision (P)          | 1.000                                       |
| Recall (R)             | 0.42 – 0.54                                 |
| False Positive Rate    | 0.000                                       |
| Validation loss (best) | 0.0618                                      |
| Overfitting observed   | Yes                                         |
| Detection behavior     | Conservative (precision-oriented)           |
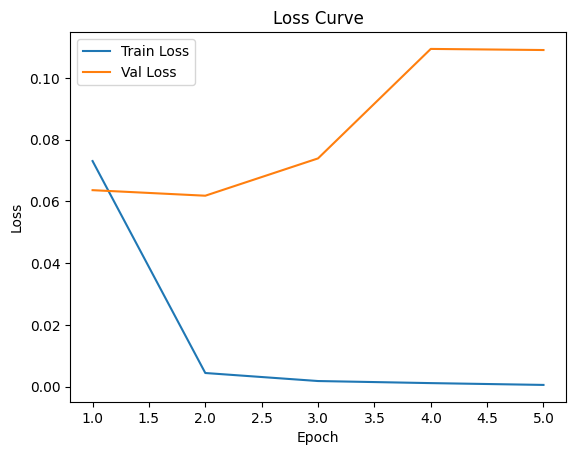
MobileNetV3-small Loss Curve
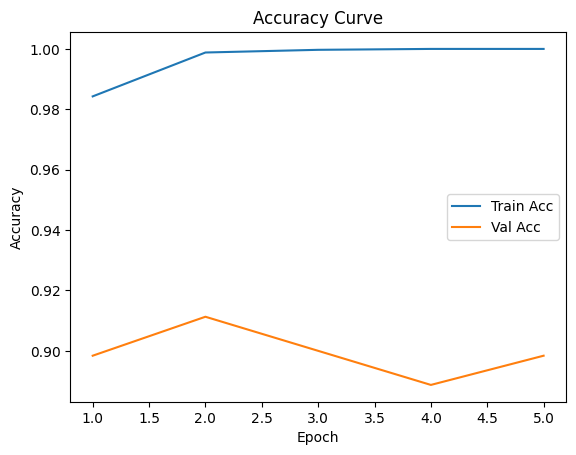
MobileNetV3-small Accuracy Curve
MobileNetV3-Small was selected as a lightweight detector for rice plant localization. While achieving very high precision (P = 1.00) and zero false positives, the model exhibited relatively low recall (R ≈ 0.45–0.54), indicating missed detections. This conservative behavior ensures clean inputs for downstream disease classification but limits overall pipeline recall. The trade-off highlights the challenge of balancing efficiency and coverage under constrained data and compute budgets.
5. Model 2 – Rice Leaf Disease Classification
Objective
Classify rice leaf disease types from cropped rice leaf images, serving as the core diagnostic component of the system.
Dataset
Source: Mendeley – Rice Leaf Disease Dataset
Split strategy:
-
Train / Validation / Test = 70% / 15% / 15%
-
Fixed random seed to ensure reproducibility
Classes: Multiple rice leaf disease categories + healthy class
Preprocessing:
-
Standard resizing and normalization
-
Augmentation applied only during training to improve robustness
Model Architecture
Backbone: DINOv2 ViT-B/14 (foundation vision model)
-
ImageNet-pretrained
-
Fully frozen during training
-
Used strictly as a feature extractor
Feature representation:
-
CLS token embedding (768-dim)
-
L2-normalized to stabilize classifier training
Classification head:
-
MLP: 768 → 256 → Num_Classes
-
ReLU activation + Dropout (0.3)
Why DINOv2?
Strong representation learning on unseen visual patterns
Robust to variations in lighting, background, and leaf orientation
Well-suited for low-data agricultural domains
Enables fast convergence and stable training when used as a frozen backbone
Training Strategy
Backbone frozen to prevent overfitting and reduce compute cost
Optimizer: AdamW
Loss: Cross-Entropy Loss
Regularization:
-
Dropout in classification head
-
Early stopping based on validation loss
Training paradigm: Feature extraction + lightweight supervised head
Output Artifact
dino_classifier.pt
Contains:
- Trained classifier weights
- Class labels
- Backbone metadata
Evaluation Results
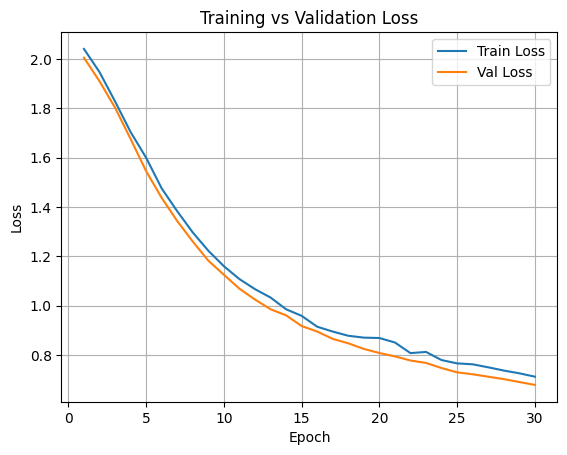
Training and Validation Loss
The model shows stable and consistent learning behavior across training epochs, with both training and validation loss decreasing steadily and no signs of divergence.
Validation accuracy improves significantly from 0.37 → 0.80, indicating that the model is able to generalize well rather than overfitting to the training data.
The small gap between training and validation accuracy in later epochs suggests effective regularization and appropriate model capacity for the dataset.
Performance gains are gradual and sustained, which is typical for multi-class image classification tasks involving visually similar disease patterns.
The model converges smoothly, with the best validation accuracy achieved at epoch 29 (80.4%), showing that extended training continues to provide meaningful improvements.
Early epochs exhibit low accuracy, reflecting the complexity of rice disease classification and high inter-class visual similarity.
Overall, the results indicate a reliable baseline model suitable for deployment or further improvement via data augmentation, fine-grained labels, or stronger backbone architectures.
6. Model 3 – 7-Day Disease Outbreak Forecasting
Objective
Forecast whether a disease outbreak will occur 7 days in the future for each spatial grid, enabling early warning and proactive intervention.
Label Construction
- Outbreak labels are generated using time-shifted targets within each grid_id:
outbreak_future_7d = outbreak(t + 7)
-
Temporal ordering is strictly preserved to prevent information leakage.
-
Samples without future observations are removed.
Feature Engineering
The model leverages short- and mid-term temporal signals combined with environmental and epidemiological context:
Disease dynamics
-
reports_3d, reports_7d, reports_14d
-
same_disease_ratio
-
dominant_disease (label-encoded)
User activity
- unique_users_7d
Environmental factors
-
rainfall_7d
-
avg_temp_7d
Data Splitting Strategy
Time-aware split based on the 80th percentile of the date distribution
Ensures realistic forecasting by training strictly on past data and evaluating on future periods
Model Design
Algorithm: XGBoost Classifier
Chosen for:
-
Strong performance on tabular data
-
Ability to model non-linear relationships and feature interactions
-
Robustness to mixed-scale features and missing patterns
Output Artifacts
outbreak_forecasting_artifact.pkl
dominant_disease_encoder.pkl
Evaluation Results
| Threshold | Accuracy | Precision (Outbreak) | Recall (Outbreak) | F1-score (Outbreak) |
|---|---|---|---|---|
| 0.3 | 0.95 | 0.64 | 0.85 | 0.73 |
| 0.4 | 0.95 | 0.67 | 0.80 | 0.73 |
| 0.5 | 0.94 | 0.68 | 0.69 | 0.69 |
| 0.6 | 0.95 | 0.73 | 0.62 | 0.67 |
-
The dataset is highly imbalanced, with outbreak cases accounting for only ~9% of samples.
-
I evaluated the XGBoost model under multiple probability thresholds to analyze the trade-off between precision and recall for outbreak detection.
-
Lower thresholds (0.3–0.4) significantly improve recall, allowing the system to detect more potential outbreaks at the cost of increased false positives.
-
Threshold = 0.3 achieves the highest recall (0.85) and best F1-score (0.73) for the outbreak class, making it suitable for early warning systems, where missing an outbreak is more critical than false alarms.
-
Higher thresholds (0.5–0.6) increase precision but reduce recall, which may be preferable in scenarios with limited intervention resources.
-
The final threshold can be adjusted depending on risk tolerance and operational constraints.
7. Key Innovations
- Foundation model (DINOv2) applied to agriculture
- Multi-stage AI pipeline (filter → classify → forecast)
- Temporal forecasting instead of static prediction
- Designed for real farmer-generated data
8. Alignment with Twin Transition (Green × Digital)
This project directly supports the Twin Transition vision:
- Green transition: early disease detection reduces crop loss and limits excessive chemical usage, improving environmental sustainability
- Digital transition: AI, foundation models, and data-driven forecasting empower farmers with real-time decision support
By integrating AI into climate-resilient agriculture, the solution demonstrates how digital technologies can accelerate green outcomes.
9. Potential Extensions
- Disease severity estimation
- Treatment & pesticide recommendation engine
- Real-time outbreak heatmap
- Farmer incentive system (points, vouchers)
10. Tech Stack
- PyTorch, TorchVision
- DINOv2 (Meta AI)
- XGBoost
- Scikit-learn
11. Reproducibility – How to Run on Google Colab (GPU)
To ensure transparent, reproducible, and accessible evaluation, this project is designed to be run entirely on Google Colab using a T4 GPU.
11.1 Environment Setup
Open Google Colab
Select Runtime → Change runtime type
Set:
-
Hardware accelerator: GPU
-
Recommended GPU: T4
Verify GPU availability:
import torch
print(torch.cuda.get_device_name(0))
11.2 Install Dependencies
!pip install -q torch torchvision torchaudio
!pip install -q xgboost scikit-learn pandas seaborn matplotlib kagglehub joblib
11.3 Dataset Preparation
Rice Leaf Disease Dataset
!wget -O rice_leaf.zip "https://data.mendeley.com/public-files/datasets/hx6f852hw4/files/bb4d2847-1cab-4e56-aa7a-4aa73f6dcdfc/file_downloaded"
!unzip rice_leaf.zip -d /content/dataset
External Datasets (Non-rice filtering)
These datasets are automatically downloaded via kagglehub inside the notebook.
⚠️ Note: Kaggle authentication is required when running for the first time.
11.4 Run Order (Recommended)
Rice / Non-Rice Filtering Model → Build clean input pipeline
Rice Leaf Disease Classification → Train DINOv2-based classifier
7-Day Outbreak Forecasting → Train XGBoost temporal prediction model
Each script is independent and can be executed sequentially in Colab.
11.5 Expected Artifacts
After successful execution, the following artifacts will be generated:
best_model.pt                       # Rice / Non-rice filter
dino_classifier.pt                  # Disease classifier
outbreak_forecasting_artifact.pkl   # Forecasting model
dominant_disease_encoder.pkl        # Label encoder
These artifacts can be reused directly for deployment or API integration.
11.6 Reproducibility Notes
Fixed random seeds for dataset splitting
Frozen backbone for disease classification
Clear threshold definitions for forecasting & filtering
This setup ensures that any evaluator or participant can reproduce the results by simply uploading the notebook to Colab and running all cells.
12. Team Notes (Youth Digital Citizen Challenge)
This project is designed to be:
- Modular – each model can be deployed independently
- Scalable – supports region-level outbreak monitoring
- Practical – aligned with real farming workflows
✨ Empowering farmers with early, AI-driven disease intelligence.